Learn How Ceph’s New Dashboard is Easy to Use and Enterprise Ready
Some people are under the impression – if it’s free, it can’t be enterprise. We’re here to tell you that’s not correct. Although Ceph is free, it carries some amazing features that validate its enterprise capabilities. In this blog, I want to focus on the Ceph dashboard and its features.
What makes the dashboard so amazing?
When you log into your Ceph cluster, you will notice a clean and organized dashboard that will show a quick overview of your cluster’s health. The dashboard includes alerts and the general health status of the entire cluster and key services such as monitors and individual disks, which we sometimes refer to as OSD (object storage daemon), a summary of key performance metrics including client IOPs and throughput, as well as some capacity metrics and placement group information.
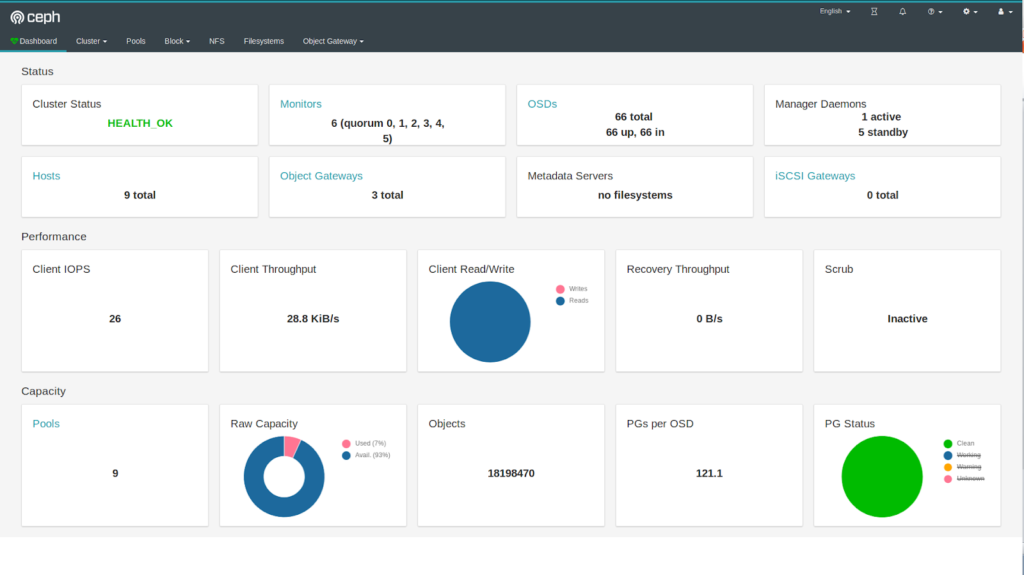
Aside from the amazing aesthetics, Ceph has several cool dashboards features. Here are four of our favorite dashboard features:
1. The Network File System (NFS)
The NFS module allows you to create NFS exports directly from the dashboard. This means you don’t have to access the command line – just click, add, and you’re ready to go. There are no restarting services, NFS dynamically exports managed via the Ceph Dashboard – it’s that easy.
2. Embedded Grafana Dashboards
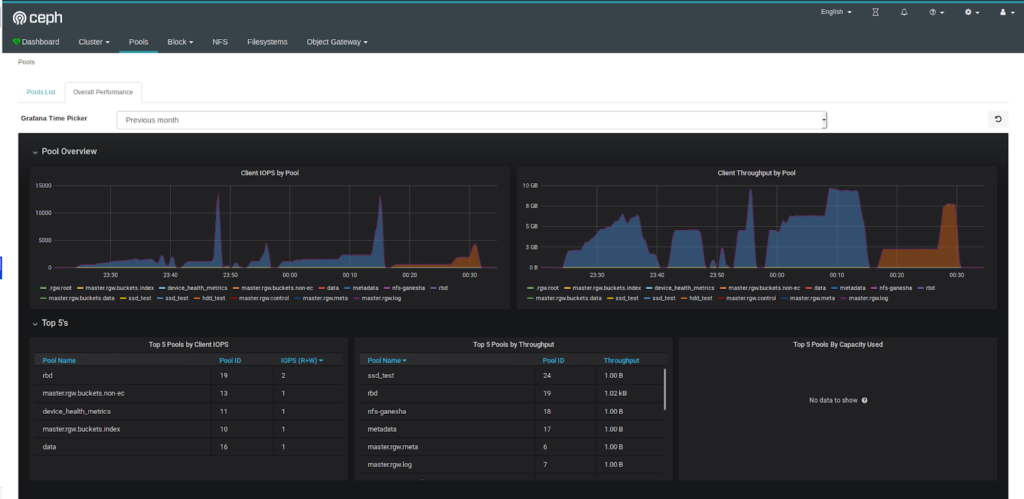
The Grafana dashboards provide several dashboards for visualization, a central dashboard for alert triggers, and a separate dashboard focused on the performance of the monitoring host itself.
3. OSD Management Screen
The OSD Management Screen is where you access everything for your hard drives. From replacing an HDD to looking up a serial number, there’s no need to go to the command line – just go to the OSD screen, and you can do everything from there.
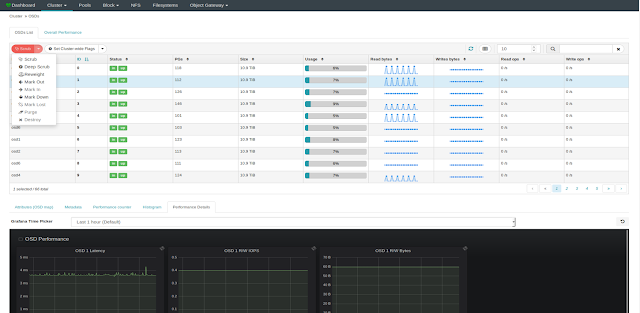
Wouldn’t it be nice to have a central place to edit your configuration? Well, with the Ceph dashboards, you do. Rather than accessing the command-line interface, the dashboard is your centralized management tool. If you need to edit your configuration – you can do it right from the dashboard.
It’s important to note that the new dashboard also supports multiple users if you have more than one person accessing the cluster. Each account consists of a username, a password (stored in encrypted form using bcrypt), an optional full name, and an optional email address.
Summary
In conclusion, the Ceph Dashboard has evolved over the years to be more user-friendly and enterprise-ready. The new Ceph dashboard offers a more flexible and extensible architecture with added management functionality making it perfect for organizations who don’t want to pay yearly licensing fees but want an easy to navigate software.
If you have any questions about Clustering or Ceph Software, reach out to us! 45Drives is a leader in Ceph Storage Clustering and is here to help you get started. We are proud to support both our hardware and Ceph Clustering Software.
____________________________________________________________________________
As always, your feedback is welcome, and we’d love to hear your input; please email info@45drives.com or leave a comment below.

